Market Outlook
April 10, 2018
Market Cues
Domestic Indices
Chg (%)
(Pts)
(Close)
Indian markets are likely to open positive tracking global indices and SGX Nifty.
BSE Sensex
0.5
162
33,789
U.S. stocks have higher lower during trading. The rebound on Wall Street Comes as
Nifty
0.5
48
10,379
traders is picking up stocks at reduced levels despite lingering concerns about a
Mid Cap
0.2
26
16,622
potential trade war between the U.S. and China. The Dow Jones closes up by 1.1%
Small Cap
0.4
68
17,951
to close at 24,196. The NASDAQ ended up by 1.5% to close at 7,019.
Bankex
0.9
251
28,106
U.K. stocks were slightly higher, with more talk of North Korean willingness to
discuss 'de-nuclearization' and hopes for strong earnings helping underpin investor
Global Indices
Chg (%)
(Pts)
(Close)
sentiment. The FTSE 100 was up by 0.2% to end at 7,194.
Dow Jones
1.1
264
24,196
On domestic front, Indian shares rose for a third consecutive session to close at
Nasdaq
1.5
105
7,019
almost four-week highs as investors downplayed fears of a global trade war and
FTSE
0.2
12
7,195
pinned hopes for strong quarterly earnings, which will be kick-started by Infosys on
Friday. The BSE Sensex ended up by 0.5% at 33,789.
Nikkei
0.5
111
21,678
Hang Seng
1.3
385
30,230
News Analysis
Shanghai Com
0.2
7
3,138
India, Bangladesh sign 6 MoUs, discuss Teesta water issue, Rohingya crisis
Detailed analysis on Pg2
Advances / Declines
BSE
NSE
Advances
1,683
1,092
Investor’s Ready Reckoner
Declines
1,080
715
Key Domestic & Global Indicators
Unchanged
159
72
Stock Watch: Latest investment recommendations on 150+ stocks
Refer Pg5 onwards
Volumes (` Cr)
Top Picks
BSE
4,498
CMP
Target
Upside
Company
Sector
Rating
(`)
(`)
(%)
NSE
27,876
Blue Star
Capital Goods Accumulate
794
867
9.2
Dewan Housing Finance
Financials
Buy
531
720
35.7
Net Inflows (` Cr)
Net
Mtd
Ytd
Century Plyboards
Forest Product Accumulate
357
400
11.9
FII
(91)
262
13,869
Navkar Corporation
Others
Buy
174
265
52.6
*MFs
984
1,884
36,344
KEI Industries
Capital Goods Accumulate
430
470
9.4
More Top Picks on Pg4
Top Gainers
Price (`)
Chg (%)
Key Upcoming Events
Previous
Consensus
IBVENTUREPP
132
8.5
Date
Region
Event Description
ReadingExpectations
ABAN
177
8.5
Apr 10, 2018 US
Producer Price Index (mom)
(0.30)
BAJAJCORP
490
7.2
Apr 11, 2018 US
Consumer price index (mom)
0.20
-
LINDEINDIA
500
6.0
Apr 11, 2018 China
Consumer Price Index (YoY)
2.90
2.60
Apr 11, 2018 UK
Industrial Production (YoY)
1.60
2.90
BALKRISIND
1,282
5.0
Apr 12, 2018 US
Initial Jobless claims
242.00
230.00
More Events on Pg7
Top Losers
Price (`)
Chg (%)
VIDEOIND
14
-6.5
VAKRANGEE
163
-5.0
JUSTDIAL
447
-3.7
MGL
979
-3.3
DALMIABHA
2765
-3.1
As on April 09, 2018
Market Outlook
April 10, 2018
News Analysis
India, Bangladesh sign 6 MoUs, discuss Teesta water issue, Rohingya
crisis
India and Bangladesh signed six MoUs, including one for the construction of a
129.5 km-long oil pipeline between Siliguri and Parbatipur, and discussed the
Teesta water sharing issue as well as the Rohingya refugee crisis. Indian Foreign
Secretary Vijay Gokhale and his Bangladeshi counterpart Md Shahidul Haque
discussed many bilateral and international issues during delegation-level talks. "Six
MoUs including India-Bangladesh Friendship pipeline between Siliguri &
Parbatipur, agreement between Department of Atomic Energy, India and
Bangladesh Atomic Energy Commission, were signed during the visit".
"The MoU focuses on deepening bilateral cooperation in the hydrocarbon
sector and the mutual benefits for both sides that would accrue from the proposed
construction of approximate 129.5 km long oil pipeline from the Siliguri Marketing
Terminal of the Numaligarah Refinery Ltd (NRL) in India to the Parbaripur depot of
the Bangladesh Petroleum Corporation (BPC)".
Economic and Political News
PM Modi ask PSUs to come up with development roadmap within 100 days
EPCES to register members in two hours, launches user interface
Power sourcing cost for industries in Odisha to rise in future
Corporate News
Gartner projects global IT spending to grow 6.2% in 2018 at Rs 3.7 trillion
Dalmia Bharat prepares its battle-plan for Friday as Binani Cement moves
SC
Max India may buy Life Healthcare's stake in JV after valuation process
Reliance Infrastructure wins Rs 10.81 billion EPC project for Kudankulam
Airtel to bring 300Mbps FTTH broadband plan with 1200 GB data
Market Outlook
April 10, 2018
Top Picks
Market Cap
CMP
Target
Upside
Company
Rationale
(` Cr)
(`)
(`)
(%)
Strong growth in domestic business due to its
leadership in acute therapeutic segment. Alkem
Alkem Laboratories
22,179
1,855
2,441
31.6
expects to launch more products in USA, which
bodes for its international business.
Favorable outlook for the AC industry to augur well
for Cooling products business which is out pacing
Blue Star
7,621
794
867
9.2
the market growth. EMPPAC division's profitability
to improve once operating environment turns
around.
With a focus on the low and medium income (LMI)
consumer segment, the company has increased its
Dewan Housing Finance
16,641
531
720
35.7
presence in tier-II & III cities where the growth
opportunity is immense.
Well capitalized with CAR of 18.1% which gives
sufficient room to grow asset base. Faster resolution
ICICI Bank
1,80,269
280
416
48.3
of NPA would reduce provision cost, which would
help to report better ROE.
High order book execution in EPC segment, rising
KEI Industries
3,367
430
470
9.4
B2C sales and higher exports to boost the revenues
and profitability
Expected to benefit from the lower capex
Music Broadcast Limited
2,231
391
475
21.5
requirement and 15 year long radio broadcast
licensing.
Massive capacity expansion along with rail
Navkar Corporation
2,614
174
265
52.6
advantage at ICD as well CFS augur well for the
company
Strong brands and distribution network would boost
Siyaram Silk Mills
3,393
724
851
17.6
growth going ahead. Stock currently trades at an
inexpensive valuation.
Market leadership in Hindi news genre and no. 2
viewership ranking in English news genre, exit from
TV Today Network
2,949
494
603
22.0
the radio business, and anticipated growth in ad
spends by corporate to benefit the stock.
After GST, the company is expected to see higher
volumes along with improving product mix. The
Maruti
2,80,669
9,291
10,619
14.3
Gujarat plant will also enable higher operating
leverage which will be margin accretive.
We expect loan book to grow at 24.3% over next
GIC Housing
2,149
399
655
64.1
two year; change in borrowing mix will help in NIM
improvement
We expect CPIL to report net Revenue/PAT CAGR of
~17%/16% over FY2017-20E mainly due to
Century Plyboards
7,939
357
400
11.9
healthy growth in plywood & lamination business,
forayed into MDF & Particle boards on back of
strong brand & distribution network.
We expect sales/PAT to grow at 13.5%/20% over
LT Foods
3,125
98
128
31.0
next two years on the back of strong distribution
network & addition of new products in portfolio.
Third largest brand play in luggage segment
Increased product offerings and improving
Safari Industries
1,434
645
690
7.9
distribution network is leading to strong growth in
business. Likely to post robust growth for next 3-4
years
We expect HSIL to report PAT CAGR of ~15% over
FY2017-20E owing to better improvement in
HSIL Ltd
2,900
401
510
27.2
operating margin due price hike in container glass
segment, turnaround in consumer business.
We expect financialisation of savings and
Aditya Birla Capital
35029
159
230
44.7
increasing penetration in Insurance & Mutual fund
would ensure steady growth.
Source: Company, Angel Research
Market Outlook
April 10, 2018
Fundamental Call
Market Cap
CMP
Target
Upside
Company
Rationale
(` Cr)
(`)
(`)
(%)
CCL is likely to maintain the strong growth trajectory
CCL Products
3,797
285
360
26.1
over FY18-20 backed by capacity expansion and new
geographical foray
We forecast Nilkamal to report top-line CAGR of ~9%
to `2,635cr over FY17-20E on the back of healthy
Nilkamal
2,436
1,633
2,178
33.4
demand growth in plastic division. On the bottom-line
front, we estimate ~10% CAGR to `162cr owing to
improvement in volumes.
The prism has diversified exposure in the different
segment such as Cement, Tile & ready mix concrete.
Prism Cement
5,756
114
160
39.9
Thus we believe, PCL is in the right place to capture
ongoing government spending on affordable housing
and infrastructure projects.
Elantas Beck India is the Indian market leader in liquid
insulation segment used in electrical equipments like
Elantas Beck India Ltd
1,740
2,195
2,500
13.9
motors, transformers etc. It derives demand from
several industries which are expected to register 10%+
CAGR in demand in the coming years.
Greenply Industries Ltd (GIL) manufactures plywood &
allied products and medium density fibreboards
(MDF). GIL to report net revenue CAGR of ~14% to
Greenply Industries
3,930
320
395
23.3
~`2,478cr over FY2017-20E mainly due to healthy
growth in plywood & lamination business on the back
of strong brand and distribution network
Ashok Leyland Ltd (ALL) is the flagship company of the
Hinduja Group, and one of the largest commercial
vehicle manufacturers in India. Ashok Leyland
Ashok Leyland
42,809
146
163
11.5
expected to report net Profit (reported) CAGR of ~19%
to
~`2,075cr over FY2017-20E mainly due to
improvement in replacement demand.
Source: Company, Angel Research
Market Outlook
April 10, 2018
Key Upcoming Events
Global economic events release calendar
Bloomberg Data
Date
Time Country
Event Description
Unit
Period
Last Reported
Estimated
Apr 10, 2018
US
Producer Price Index (mom)
% Change
Mar
(0.30)
Apr 11, 2018
6:00 PMUS
Consumer price index (mom)
% Change
Mar
0.20
-
7:00 AMChina
Consumer Price Index (YoY)
% Change
Mar
2.90
2.60
2:00 PMUK
Industrial Production (YoY)
% Change
Feb
1.60
2.90
Apr 12, 2018
6:00 PMUS
Initial Jobless claims
Thousands
Apr 7
242.00
230.00
India
Exports YoY%
% Change
Mar
4.48
Apr 13, 2018
5:30 PMIndia
Industrial Production YoY
% Change
Feb
7.50
6.90
India
Imports YoY%
% Change
Mar
10.41
China
Exports YoY%
% Change
Mar
44.50
11.80
Apr 16, 2018
12:00 PMIndia
Monthly Wholesale Prices YoY%
% Change
Mar
2.48
2.65
Apr 17, 2018
2:00 PMUK
Jobless claims change
% Change
Mar
9.20
6:45 PMUS
Industrial Production
%
Mar
0.95
0.30
6:00 PMUS
Housing Starts
Thousands
Mar
1,236.00
1,260.00
6:00 PMUS
Building permits
Thousands
Mar
1,321.00
1,320.00
7:30 AMChina
Industrial Production (YoY)
% Change
Mar
6.20
6.40
7:30 AMChina
Real GDP (YoY)
% Change
1Q
6.80
6.80
Apr 18, 2018
2:00 PMUK
CPI (YoY)
% Change
Mar
2.70
7:30 PMEuro Zone
Euro-Zone Consumer Confidence
Value
Apr A
0.10
Apr 20, 2018
2:30 PMEuro Zone
Euro-Zone CPI (YoY)
%
Mar F
1.40
Apr 23, 2018
1:00 PMGermany
PMI Services
Value
Apr P
53.90
1:00 PMGermany
PMI Manufacturing
Value
Apr P
58.20
7:30 PMUS
Existing home sales
Million
Mar
5.54
Apr 24, 2018
7:30 PMUS
Consumer Confidence
S.A./ 1985=100
Apr
127.70
7:30 PMUS
New home sales
Thousands
Mar
618.00
Source: Bloomberg, Angel Research
Market Outlook
April 10, 2018
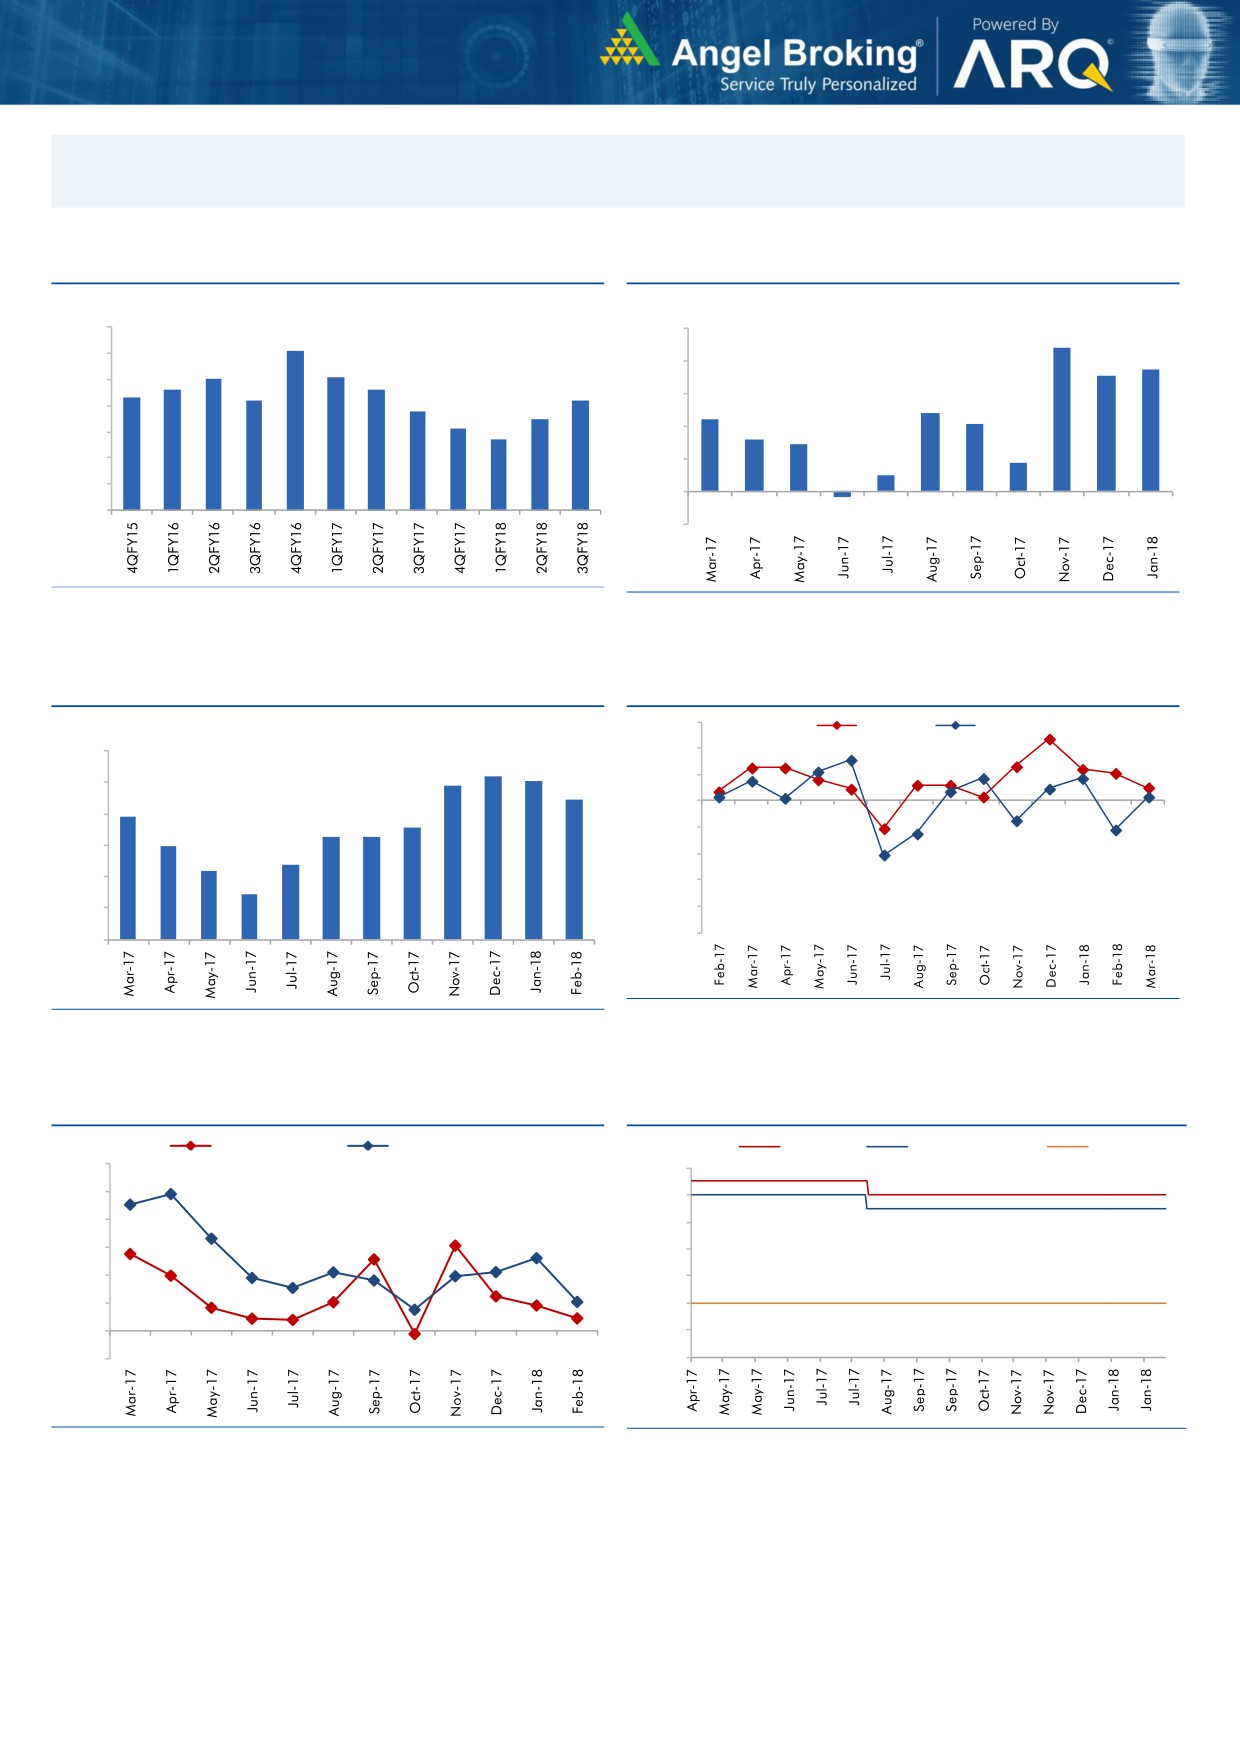
Macro watch
Exhibit 1: Quarterly GDP trends
Exhibit 2: IIP trends
(%)
(%)
10.0
10.0
9.1
8.8
9.0
7.5
8.0
8.1
8.0
7.1
7.6
7.6
8.0
7.3
7.2
7.2
6.8
6.0
4.8
7.0
6.5
4.4
6.1
4.1
5.7
4.0
3.2
2.9
6.0
1.8
5.0
2.0
1.0
4.0
-
3.0
(0.3)
(2.0)
Source: CSO, Angel Research
Source: MOSPI, Angel Research
Exhibit 3: Monthly CPI inflation trends
Exhibit 4: Manufacturing and services PMI
56.0
Mfg. PMI
Services PMI
(%)
6.0
54.0
5.2
5.1
4.9
52.0
5.0
4.4
3.9
50.0
4.0
3.6
3.3
3.3
3.0
48.0
3.0
2.4
2.2
46.0
2.0
1.5
44.0
1.0
42.0
40.0
-
Source: Market, Angel Research; Note: Level above 50 indicates expansion
Source: MOSPI, Angel Research
Exhibit 5: Exports and imports growth trends
Exhibit 6: Key policy rates
(%)
Exports yoy growth
Imports yoy growth
(%)
Repo rate
Reverse Repo rate
CRR
60.0
6.50
50.0
6.00
40.0
5.50
30.0
5.00
20.0
4.50
10.0
4.00
0.0
3.50
(10.0)
3.00
Source: Bloomberg, Angel Research
Source: RBI, Angel Research
Market Outlook
April 10, 2018
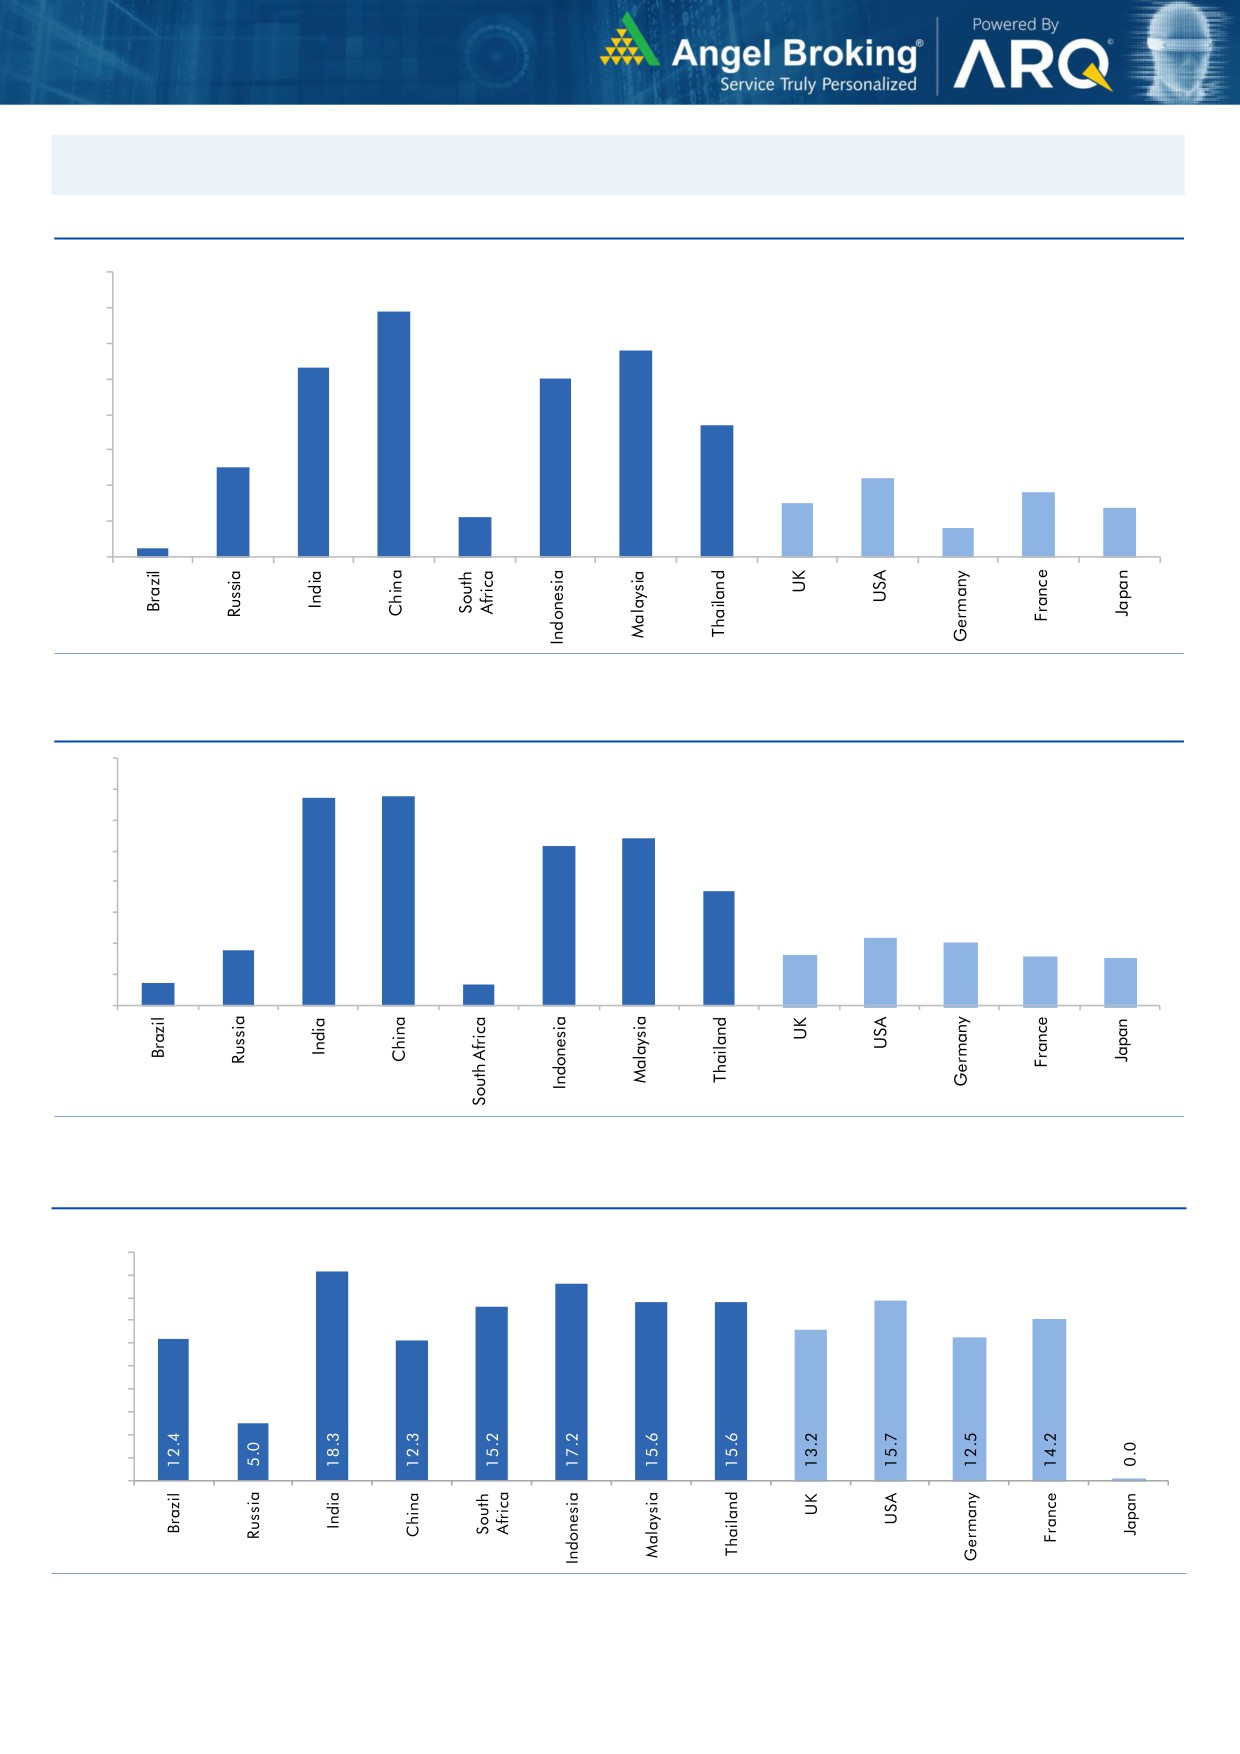
Global watch
Exhibit 1: Latest quarterly GDP Growth (%, yoy) across select developing and developed countries
(%)
8.0
6.9
7.0
5.8
6.0
5.3
5.0
5.0
1.1
3.7
4.0
2.5
3.0
2.2
1.8
2.0
1.5
1.4
0.8
1.0
0.3
-
Source: Bloomberg, Angel Research
Exhibit 2: 2017 GDP Growth projection by IMF (%, yoy) across select developing and developed countries
(%)
6.7
6.8
7.0
6.0
5.4
5.2
5.0
3.7
4.0
3.0
1.8
2.2
2.0
1.7
1.6
2.0
0.7
1.5
0.7
1.0
-
Source: IMF, Angel Research
Exhibit 3: One year forward P-E ratio across select developing and developed countries
(x)
20.0
18.0
16.0
14.0
12.0
10.0
8.0
6.0
4.0
2.0
-
Source: IMF, Angel Research as on 06 April,2018
Market Outlook
April 10, 2018
Exhibit 4: Relative performance of indices across globe
Returns (%)
Country
Name of index
Closing price
1M
3M
1YR
Brazil
Bovespa
83,307
(2.5)
6.8
27.6
Russia
Micex
2,286
1.4
7.1
11.4
India
Nifty
10,379
1.3
(0.6)
12.4
China
Shanghai Composite
3,138
(3.3)
(4.3)
(2.4)
South Africa
Top 40
49,391
(3.2)
(6.2)
8.0
Mexico
Mexbol
48,059
0.7
(3.5)
(2.3)
Indonesia
LQ45
1,022
(4.0)
(5.6)
11.3
Malaysia
KLCI
1,850
0.5
2.6
5.7
Thailand
SET 50
1,159
(0.9)
(0.7)
16.2
USA
Dow Jones
23,979
(3.3)
(4.4)
16.1
UK
FTSE
7,195
0.7
(6.9)
(2.1)
Japan
Nikkei
21,678
2.0
(7.8)
14.6
Germany
DAX
12,262
1.2
(7.9)
0.3
France
CAC
5,263
1.8
(3.8)
3.2
Source: Bloomberg, Angel Research as on 06 April,2018 p68in4